> For the complete documentation index, see [llms.txt](https://codifi-fdm.gitbook.io/codifi-docs/llms.txt). Markdown versions of documentation pages are available by appending `.md` to page URLs; this page is available as [Markdown](https://codifi-fdm.gitbook.io/codifi-docs/web-app/the-project-workspace/map-layers-and-feature-info.md).

# Map Layers & Feature Info

Everything drawn on the web map is clickable, and everything on it can be switched on, faded back, or zoomed to from one panel. This page covers the two controls you will use constantly in the office: the **Layers** panel, which decides what is on the map, and the **feature info card**, which tells you what you just clicked.

{% hint style="info" %}
**One click, everything under it.** The map does not make you pick a layer first. Click a spot and Codifi collects every feature underneath — your Records, overlay features, and raster footprints alike — then lets you step through them.
{% endhint %}

***

## The Layers Panel

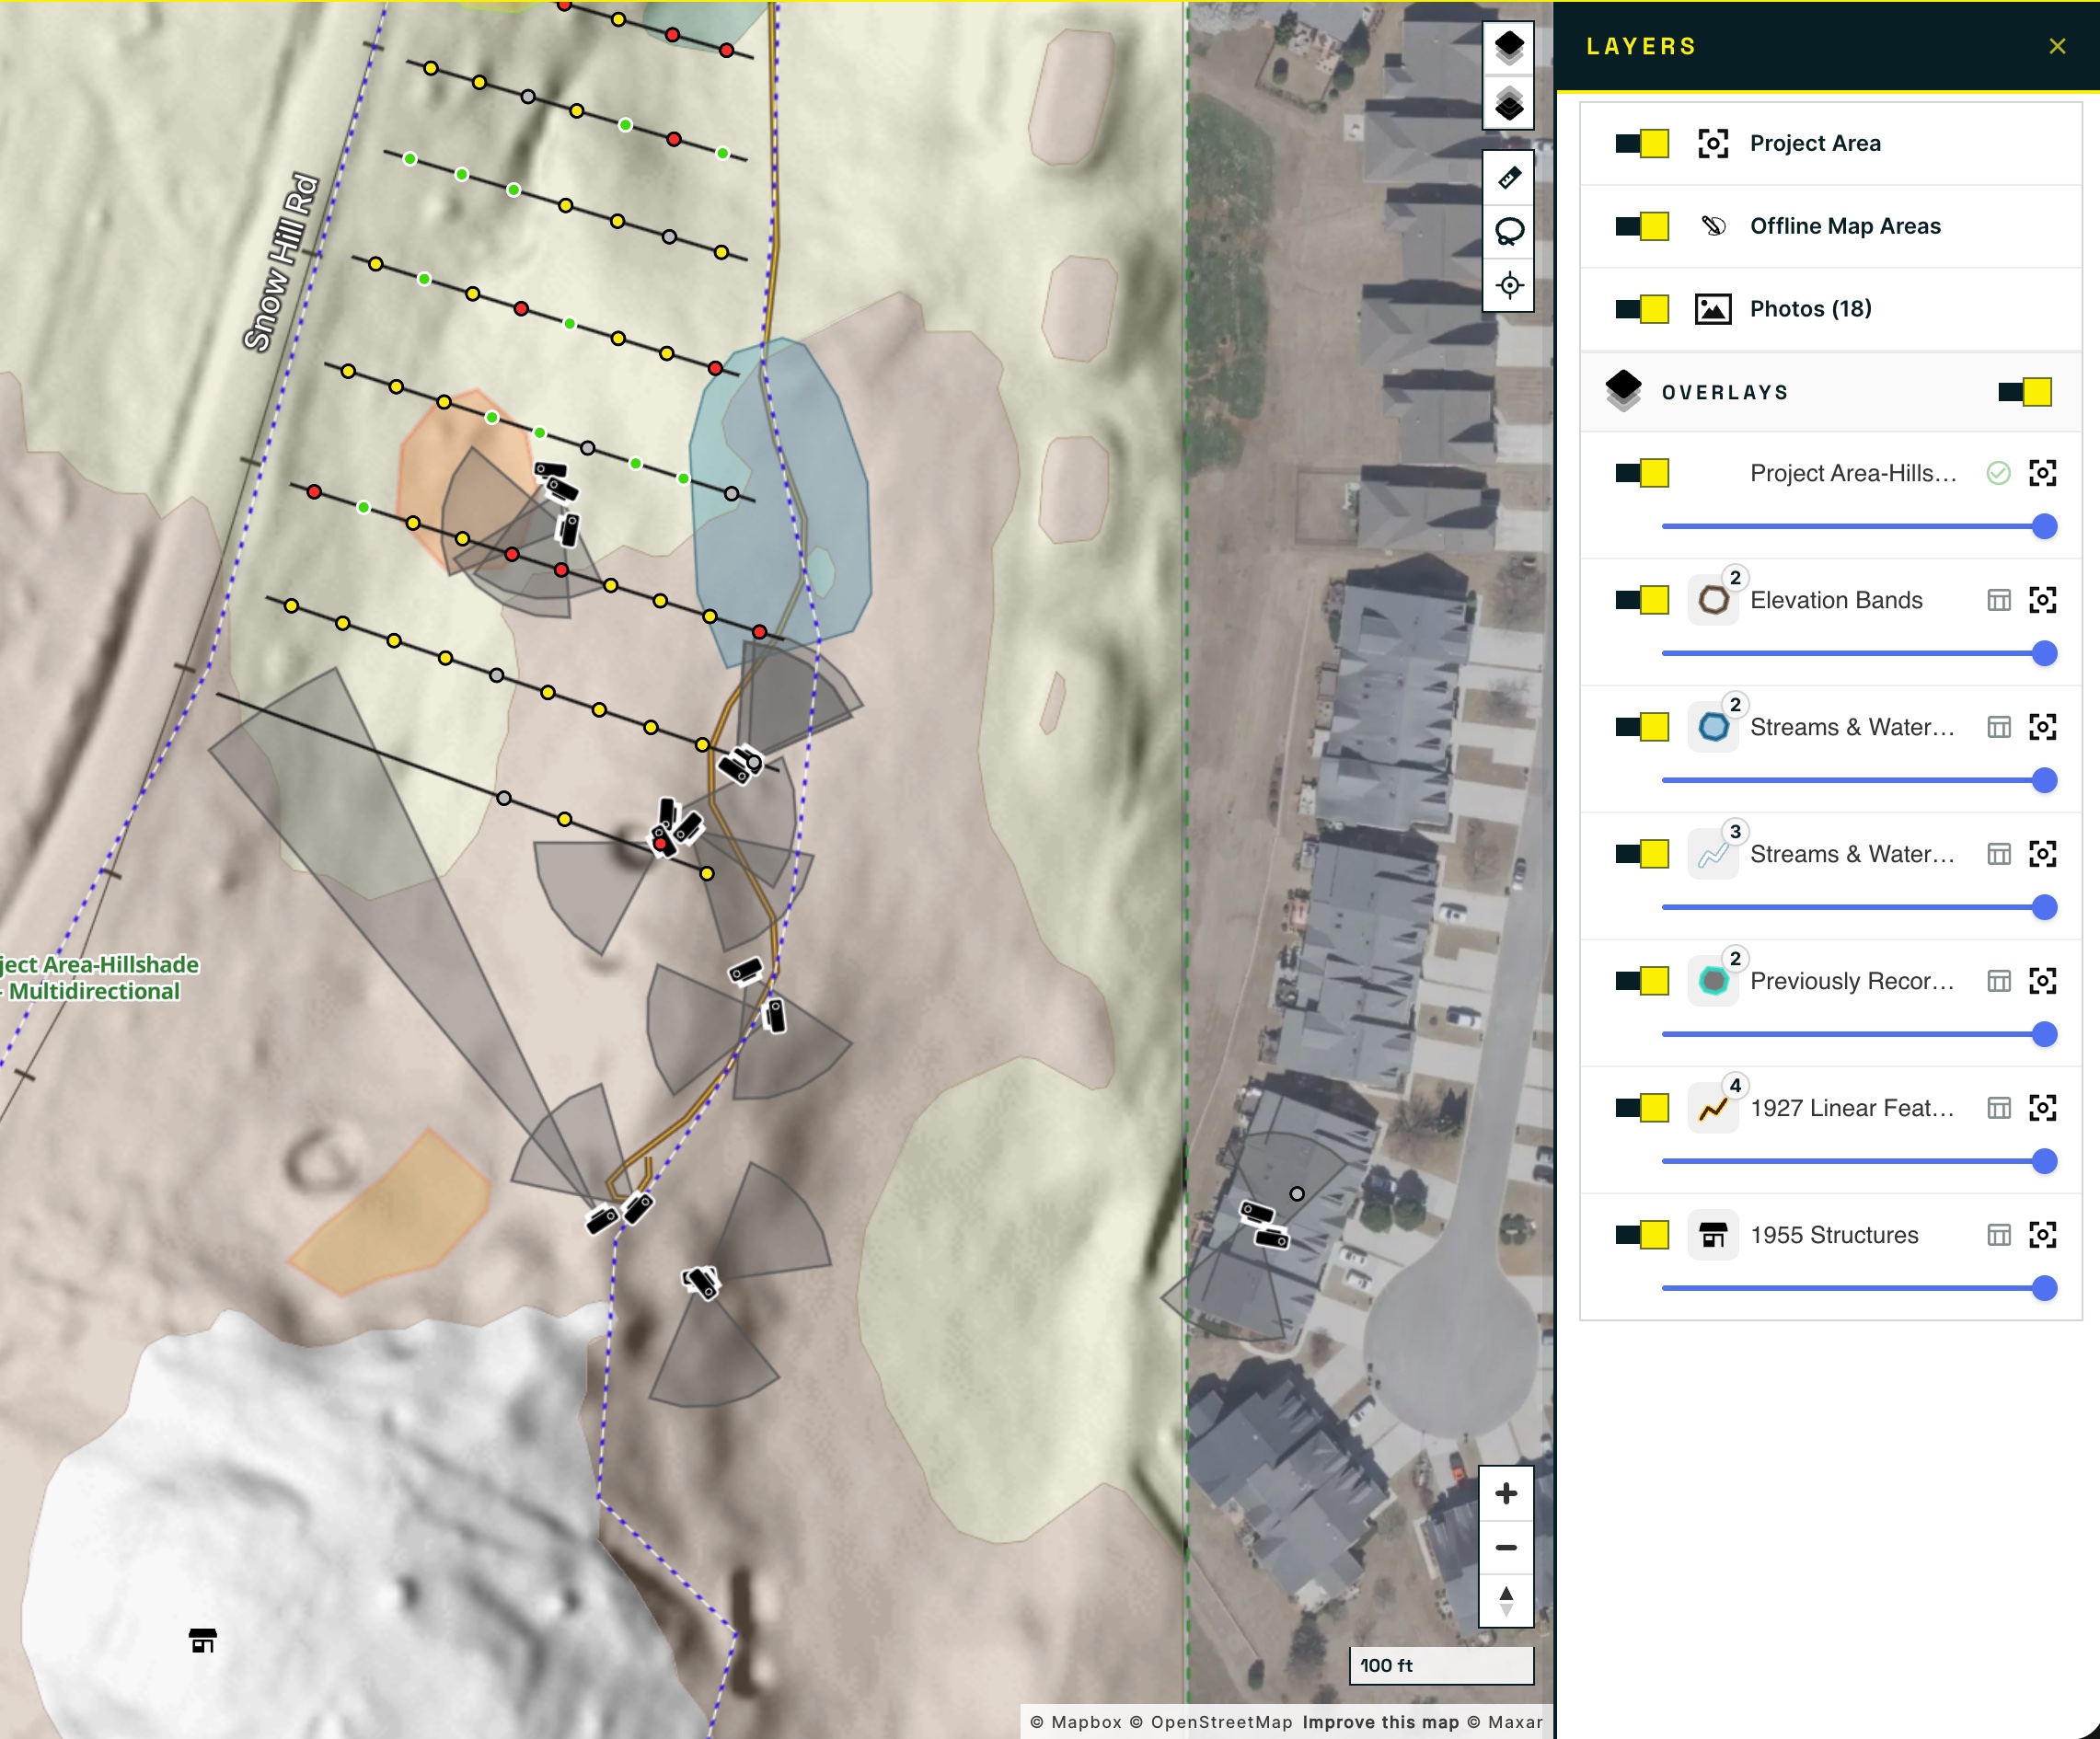
Open the Layers panel from the layers control on the map. It lists everything the Project can draw, in the order it draws it.

Three entries sit at the top and are always present:

* **Project Area** — the Project's own boundary.
* **Offline Map Areas** — the extents crews have downloaded for the field.
* **Photos (n)** — geotagged photos, with the count of how many the Project holds.

Below those, **Overlays** groups every layer a project manager has uploaded. The group has its own master toggle, so you can clear all overlays at once without losing each layer's individual setting.

<figure><img src="https://3544178300-files.gitbook.io/~/files/v0/b/gitbook-x-prod.appspot.com/o/spaces%2FJ8P3pqhxdFwQkIOjOUut%2Fuploads%2Fgit-blob-5a6c5e423832f77c0ba4b708ac1eedea260d1017%2Fworkspace-layers-panel.jpg?alt=media" alt="The Layers panel open beside the map, listing Project Area, Offline Map Areas, and Photos above an Overlays group containing vector and raster layers, each with a toggle, feature count, and opacity slider"><figcaption><p>The <strong>Layers</strong> panel. The map behind it shows a raster overlay ending mid-view, which is exactly the situation footprints are meant to explain.</p></figcaption></figure>

### What each overlay row gives you

| Control                   | What it does                                                      |
| ------------------------- | ----------------------------------------------------------------- |
| **Toggle**                | Shows or hides the layer. Yellow is on, gray is off.              |
| **Geometry icon + count** | The layer's geometry type, badged with how many features it holds |
| **Table icon**            | Opens the layer's attribute table                                 |
| **Center icon**           | Zooms the map to that layer's extent                              |
| **Opacity slider**        | Fades the layer back so you can see what is underneath            |

The opacity slider is the one people underuse. A hillshade or a historic quad at full strength buries your Records; pulled back to a third it gives you terrain context without competing with your data.

{% hint style="info" %}
**Raster rows look different on purpose.** A raster has no attribute table to open, so that icon is absent. In its place a raster carries a **cloud** icon for downloading its tiles.
{% endhint %}

***

## Clicking a Feature

Click anything on the map and an info card opens. The header names what you are looking at, and just beneath it a counter reads **N features here**, with arrows to step through the rest of the stack.

That stack matters more than it sounds. A single shovel test can sit inside a project area, on top of an elevation band, under two raster footprints, and inside a previously recorded site boundary all at once. Rather than making you toggle layers off until only one thing is left, the card holds all of them and lets you page across.

### A Codifi Record

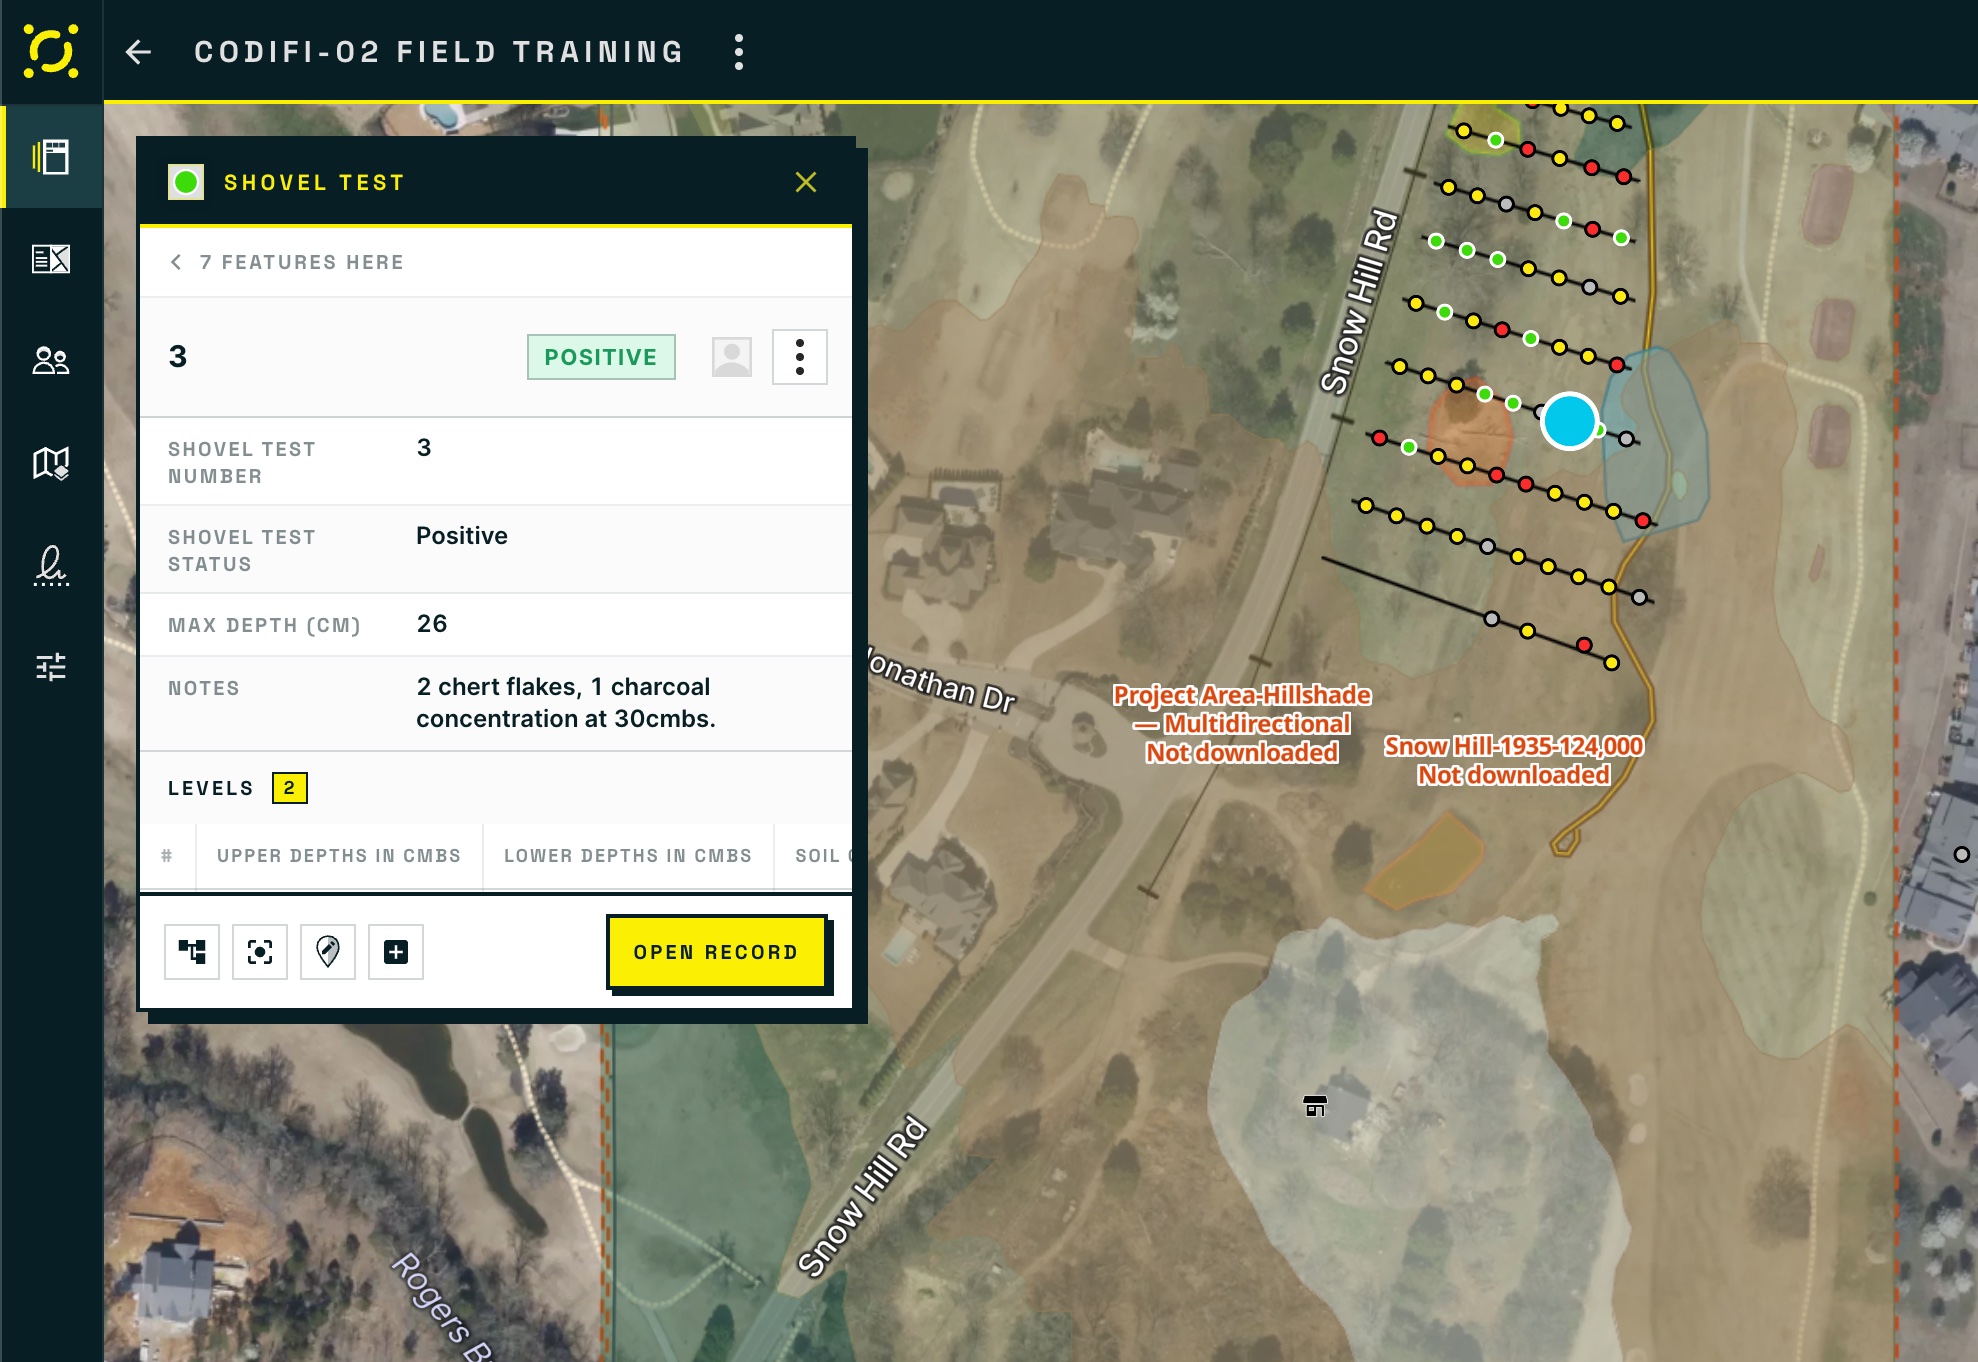
<figure><img src="https://3544178300-files.gitbook.io/~/files/v0/b/gitbook-x-prod.appspot.com/o/spaces%2FJ8P3pqhxdFwQkIOjOUut%2Fuploads%2Fgit-blob-5a7000d9a385a8303c80cafca80f1c99dc97ac75%2Fworkspace-feature-info-record.jpg?alt=media" alt="A Shovel Test info card showing the Record number, a Positive status chip, its Fields, a Levels repeater count, and an Open Record button, with the selected Record highlighted on the map"><figcaption><p>A Record's card carries its status chip, its Fields, and its repeater sections. <strong>Open Record</strong> goes to the full form; everything above it is readable without leaving the map.</p></figcaption></figure>

A Record's card leads with its title, its status chip, and who it is assigned to, then lists its Fields. Repeater sections appear with a count and their column headers, so a shovel test that has two levels recorded says so before you open anything.

This is the fastest QA loop the web app has. Click a point, read its notes and depths, page to the next feature, and never leave the map.

### An Overlay Feature

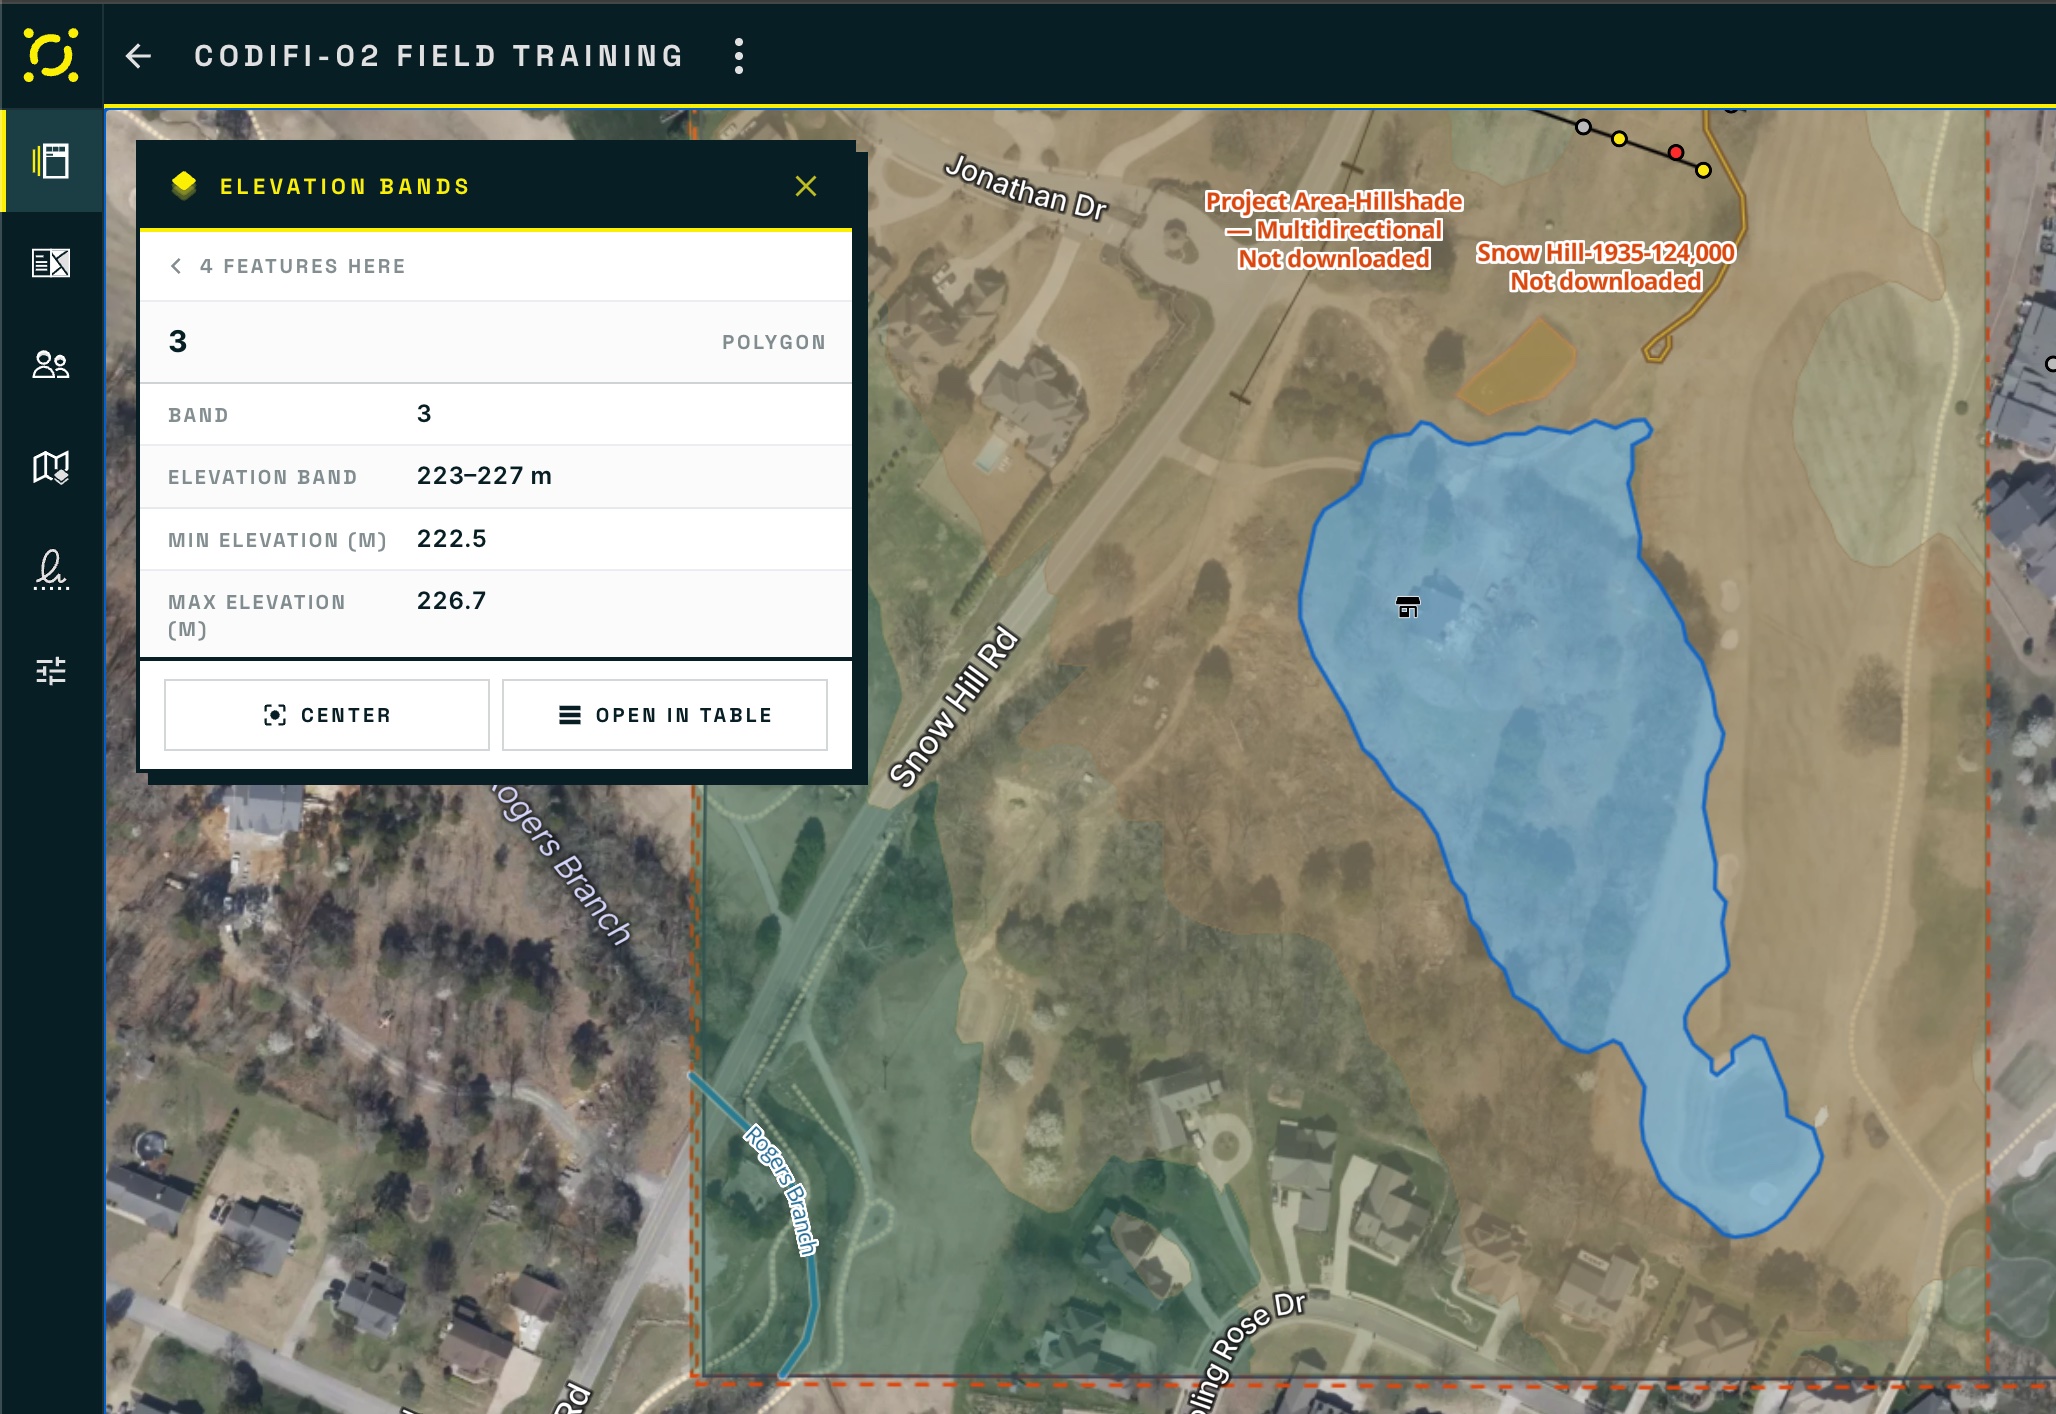
<figure><img src="https://3544178300-files.gitbook.io/~/files/v0/b/gitbook-x-prod.appspot.com/o/spaces%2FJ8P3pqhxdFwQkIOjOUut%2Fuploads%2Fgit-blob-3fa781f5e67fcf9763a580f1c1c71c9bb5bd5151%2Fworkspace-feature-info-overlay.jpg?alt=media" alt="An Elevation Bands info card showing the feature&#x27;s geometry type and its band, elevation range, minimum and maximum elevation attributes, with Center and Open in Table buttons"><figcaption><p>An overlay feature shows its attributes exactly as they came from the source data. <strong>Open in Table</strong> jumps to the same feature in the layer's attribute table.</p></figcaption></figure>

An overlay feature's card names its geometry type and lists its attributes as they arrived from the source file. Nothing is renamed or reformatted, so what you read here is what a GIS analyst would see in the original data.

Two actions sit at the bottom. **Center** brings the map to the feature. **Open in Table** takes you to that same feature in the layer's attribute table, which is where you go when you want to compare it against its neighbors.

### A Raster Footprint

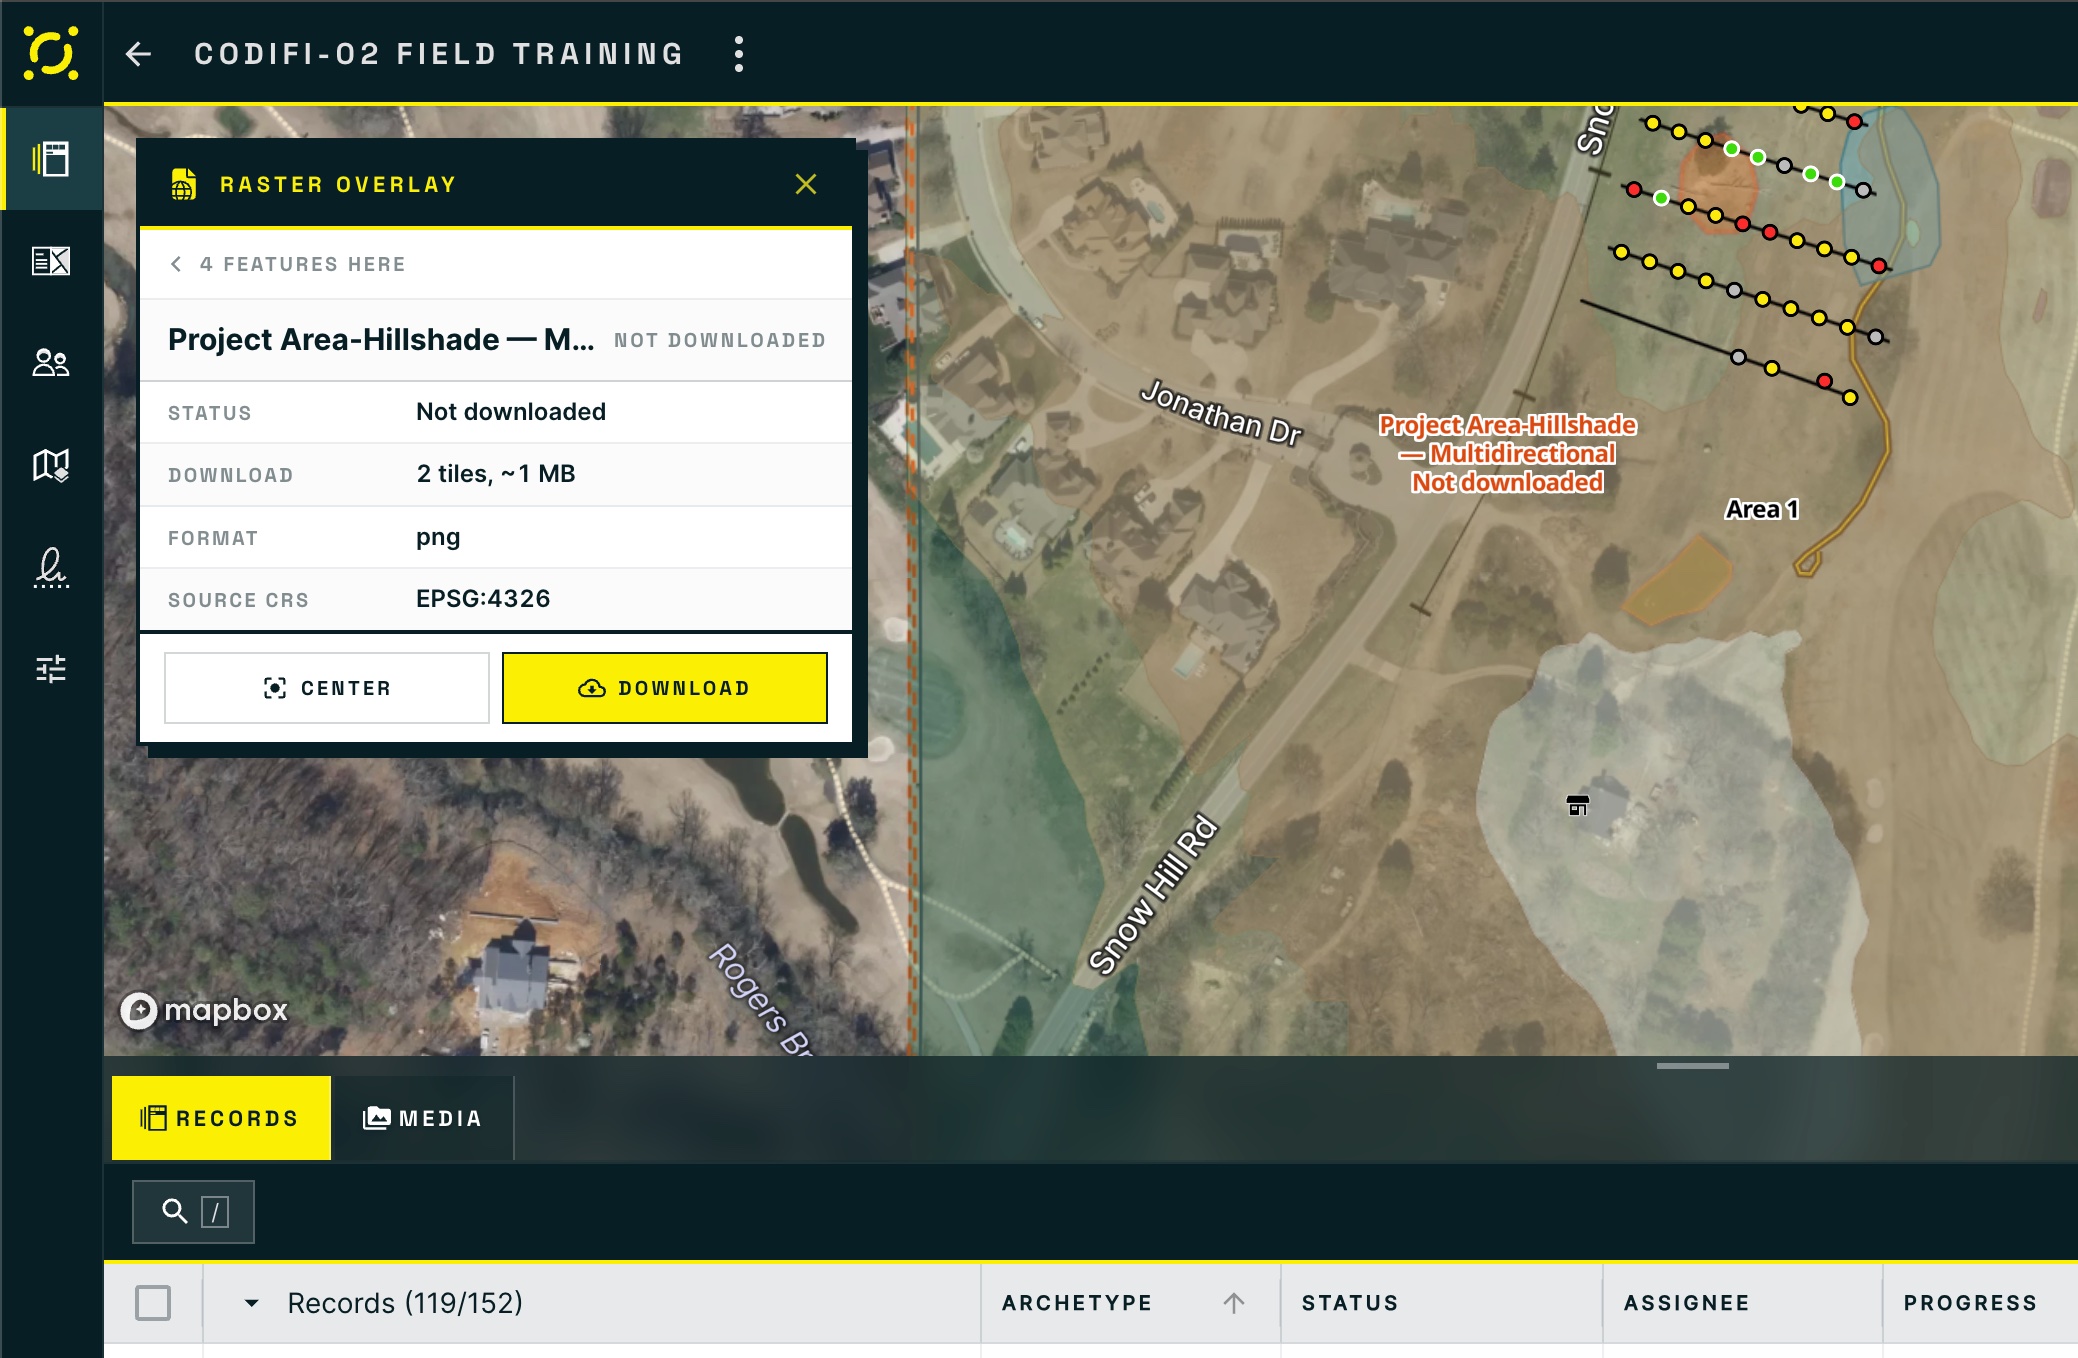
<figure><img src="https://3544178300-files.gitbook.io/~/files/v0/b/gitbook-x-prod.appspot.com/o/spaces%2FJ8P3pqhxdFwQkIOjOUut%2Fuploads%2Fgit-blob-cd789357e25f604f824b5e0a086c2cec413b6c13%2Fworkspace-feature-info-raster.jpg?alt=media" alt="A Raster Overlay info card showing status Not downloaded, a download size of 2 tiles at about 1 MB, PNG format, and source CRS EPSG:4326, with Center and Download buttons"><figcaption><p>A raster's card is about whether you have it, not what is in it — status, download size, format, and source CRS, with <strong>Download</strong> right there.</p></figcaption></figure>

Rasters have no attributes, so their card answers a different question: do you have this imagery yet, and what will it cost you to get it?

| Row            | Why it matters                                     |
| -------------- | -------------------------------------------------- |
| **Status**     | Whether the tiles are already downloaded           |
| **Download**   | Tile count and approximate size, before you commit |
| **Format**     | The image format the tiles are stored in           |
| **Source CRS** | The coordinate system the raster was authored in   |

***

## Downloading Raster Tiles

A raster layer can be on the map as a labeled **footprint** without its imagery being present. The footprint shows which sheet covers which ground, captioned in red with **Not downloaded** where that applies, so you can tell what to fetch before you fetch it.

There are two ways to pull the tiles down:

{% stepper %}
{% step %}
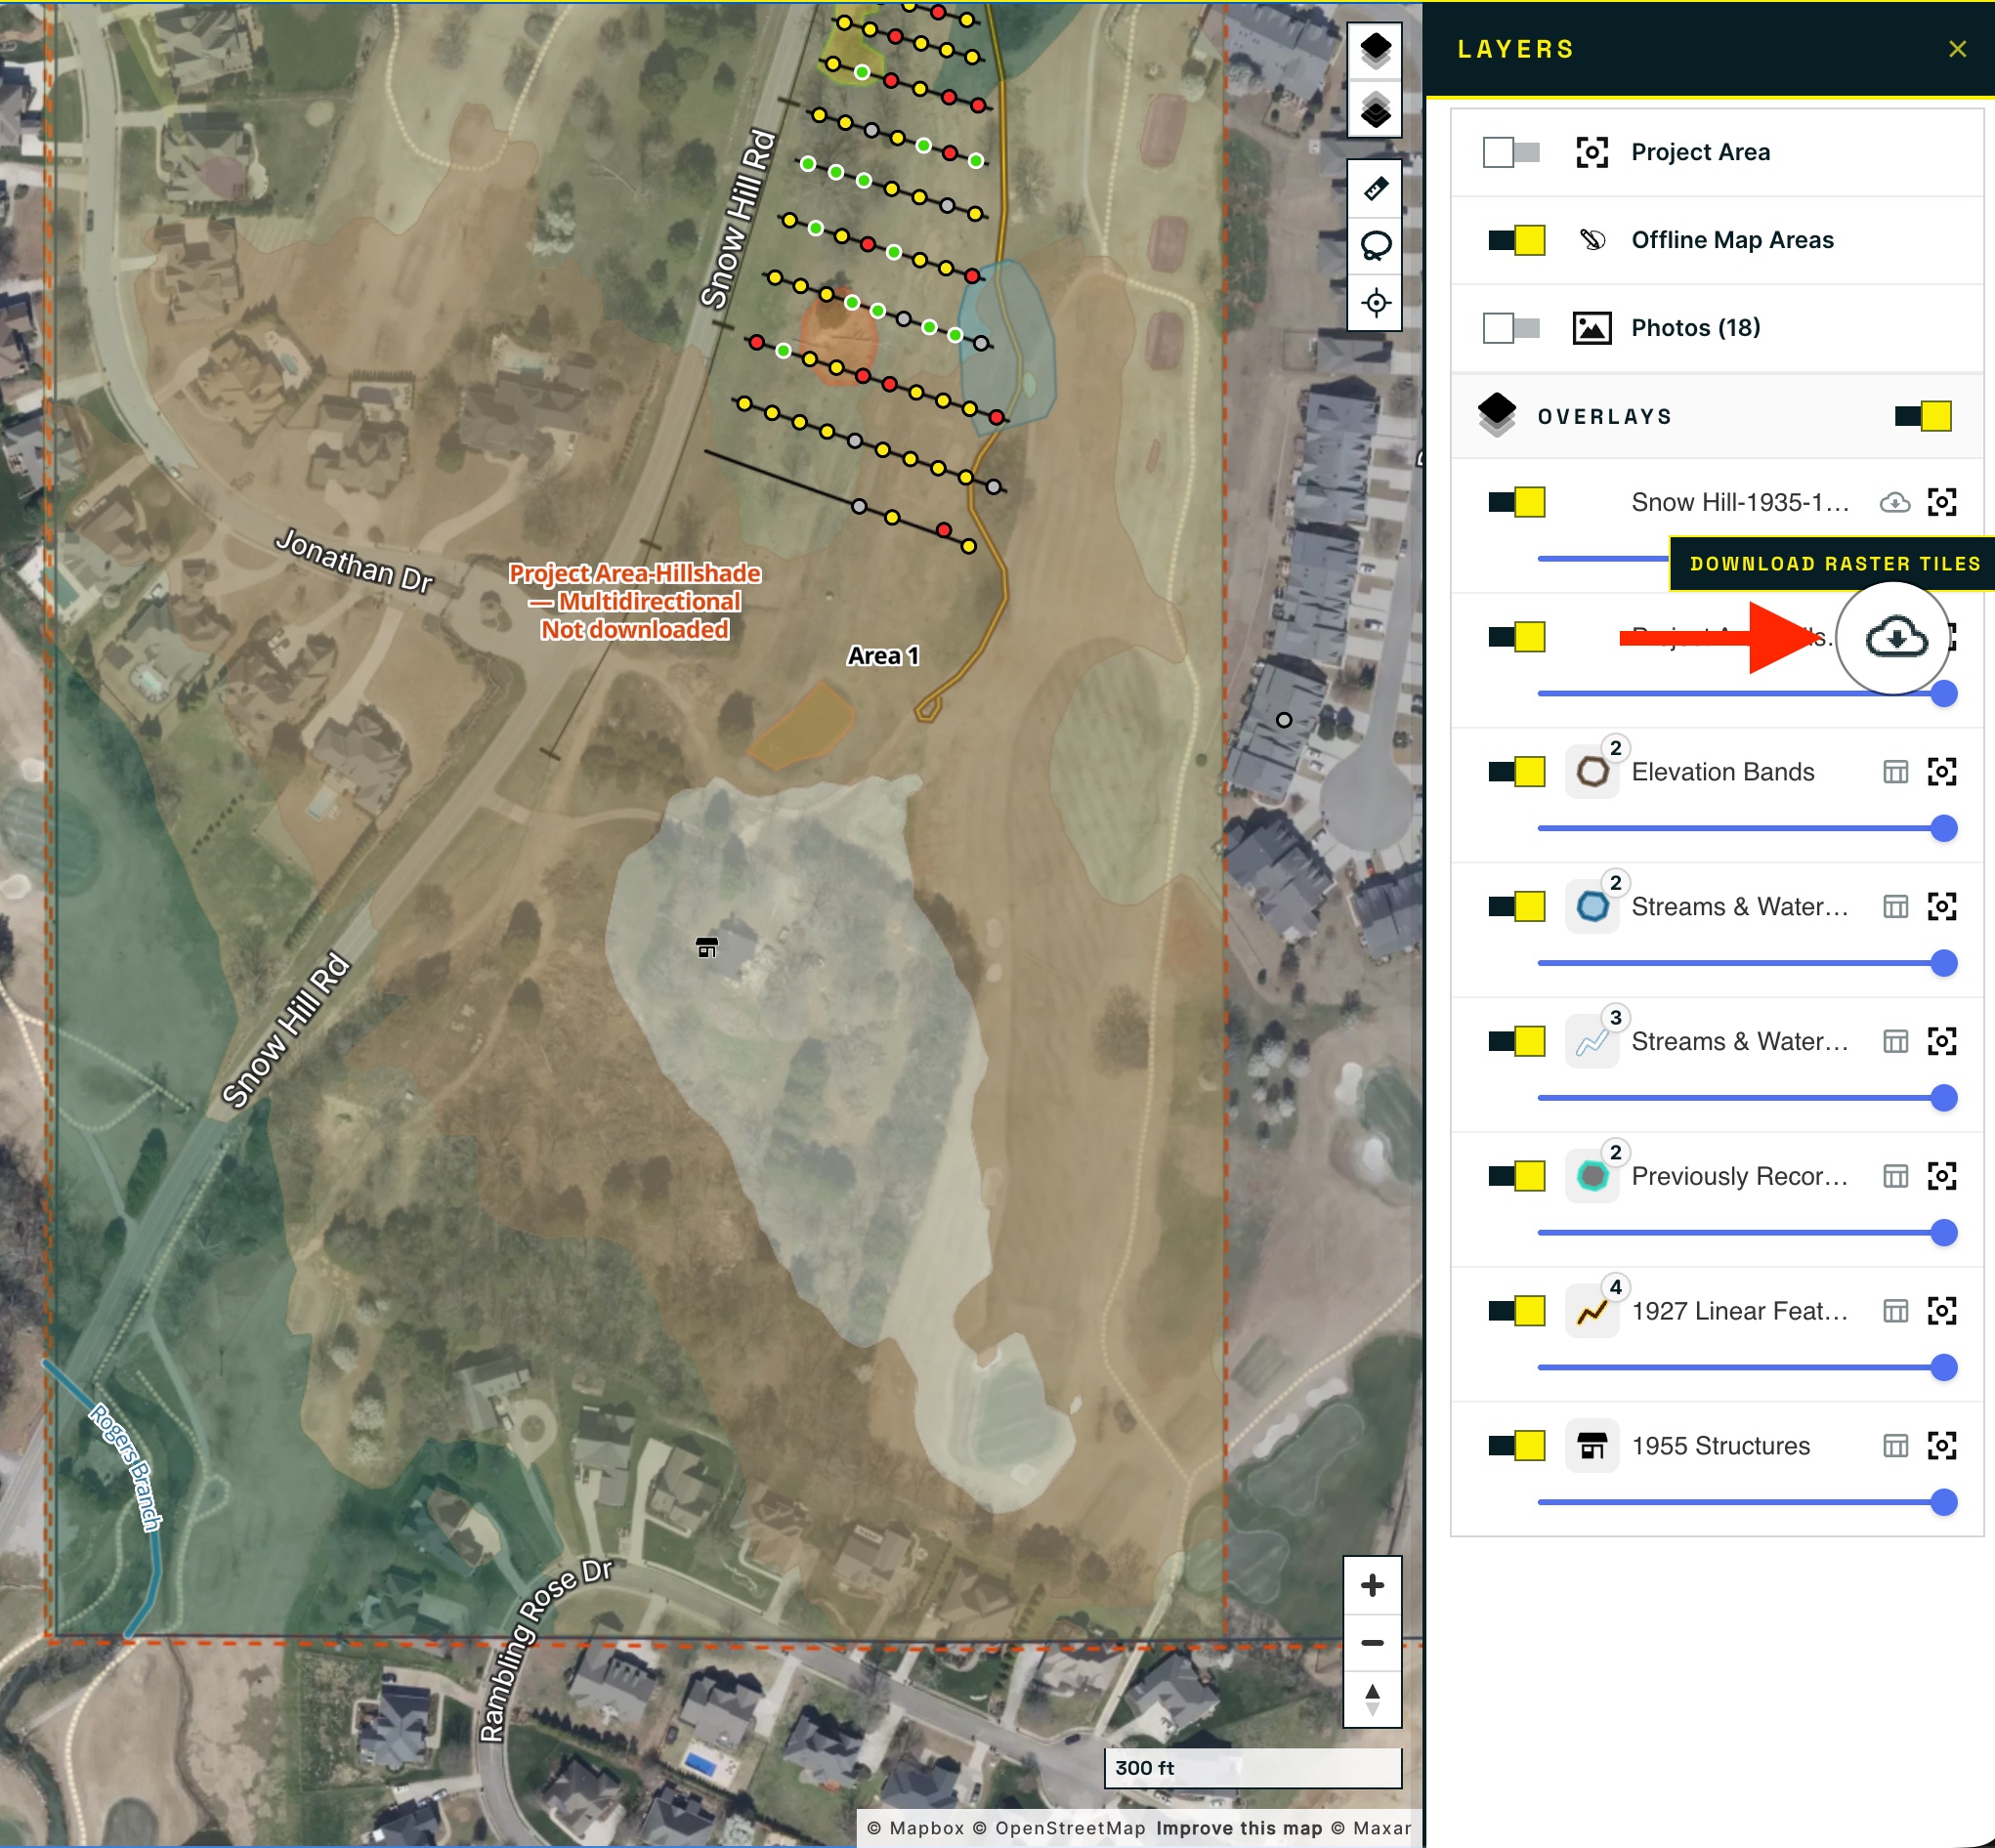
**From the Layers panel.** Click the **cloud** icon on the raster's row.

<figure><img src="https://3544178300-files.gitbook.io/~/files/v0/b/gitbook-x-prod.appspot.com/o/spaces%2FJ8P3pqhxdFwQkIOjOUut%2Fuploads%2Fgit-blob-bd7cf6de5f44f2d7c422c5344686d9467b26a3df%2Fworkspace-raster-download-tiles.jpg?alt=media" alt="The Layers panel with the cursor on a raster layer&#x27;s cloud icon, showing a Download Raster Tiles tooltip"><figcaption><p>The <strong>Download Raster Tiles</strong> control on a raster row. Project Area and Photos are toggled off here, which is why their toggles read gray.</p></figcaption></figure>
{% endstep %}

{% step %}
**From the footprint itself.** Click the footprint on the map and press **Download** on its info card — useful when you are looking at a gap in coverage and want to fill exactly that sheet.
{% endstep %}
{% endstepper %}

{% hint style="info" %}
**Check the size first.** The card tells you the tile count and approximate download before you start. A single quad is usually trivial; a full historic series across a large Project is not.
{% endhint %}

***

## Related

* [The Project Workspace](/codifi-docs/web-app/the-project-workspace.md) — the Map, Split, and List views this sits inside
* [Map Overlays](/codifi-docs/web-app/map-setup-and-offline-areas/map-overlays.md) — uploading and styling the layers listed here
* [Map Styles](/codifi-docs/web-app/map-setup-and-offline-areas/map-overlays/styles.md) — controlling how overlay features are drawn
* [Viewing Overlays on Mobile](/codifi-docs/web-app/map-setup-and-offline-areas/map-overlays/viewing-overlays-on-mobile.md) — the same layers in the field
* [Draw Mode & GeoTools](/codifi-docs/web-app/draw-mode-and-geotools.md) — editing the geometry you inspect here